In recently attempting to understand the intuition behind basic probability theory, I found myself unable to think past the tangible reality of what it all meant. You flip a coin a couple times, and you see mixed results. You try to guess its next move, but it always outwits you. You’ve flipped the coin twenty times now, and you don’t see a pattern. You get heads a couple times, followed by tails five times, then heads three times and tails six more times. There just doesn’t seem to be a pattern here.
But probability theory says that over a large enough number of coin flips, eventually, the number of resulting heads will approximately equal the number of tails.
Now, this seems like basic probability, the kind we learn in grade school: there are two possibilities, and one result per flip. That means there’s a one in two chance of getting heads, and a one in two chance of getting tails, or a 1/2 probability, or 50/50.
What troubled me was, given that the outcome of every individual coin toss is random, how is it possible that over the long run, they begin to conform to certain outcomes, as predicted by our equations? In other words, what is this invisible force that makes coin outcomes converge to predefined ratios, and if this force wasn’t acting on the individual coin flips, then at what point does this force actually begin affecting the results?
You can see by my use of words like “invisible force” that I didn’t quite understand the concept.
There was an invisible force, however, that helped make this concept click for me.
An excerpt from a short book I was reading described the solution to my confusion elegantly. Carlo Rovelli, in Seven Brief Lessons on Physics, writes:
“Teaspoon [heating] and balloon [popping] behave as they must, following the laws of physics in complete independence from what we know or don’t know about them. The predictability or unpredictability of their behavior does not pertain to their precise condition; it pertains to the limited set of their properties with which we interact. This set of properties depends on our specific way of interacting with the teaspoon or the balloon. Probability does not refer to the evolution of matter in itself. It relates to the evolution of those specific quantities we interact with. Once again, the profoundly relational nature of the concepts we use to organize the world emerges. The cold teaspoon heats up in hot tea because tea and spoon interact with us through a limited number of variables among the innumerable variables that characterize their microstate. The value of these variables is not sufficient to predict future behavior exactly (witness the balloon) but is sufficient to predict with optimum probability that the spoon will heat up.”
This made sense to me. Statistics isn’t, “hey look at these equations we came up with, and look how in real life, reality conforms to these equations. We’re so smart.” It’s more like “hey look at this weird behavior of this real life object. We don’t fully understand how it behaves, but check this out: we can still plot its behavior in the long run. It’s pretty frustrating that we don’t understand its behavior exactly, but at least we can still express that behavior in a language that we can understand and also manipulate, i.e equations.”
So I think probability theory is a temporary language. I think it’s our way of building up to a better language that can more accurately point to and describe real life phenomena. There’s no way in hell science or mathematics is going to see a certain phenomena and not attempt to find a way, anyway, to put it on paper. We have to. And probability theory is really the best we can do at this point.
So it’s not, “we have these equations that the laws of the universe oblige to” (“over large numbers“), but rather, “look at this strange behavior in the universe: here’s a way we can express that in a way that works fine for now and allows us to make predictions on that data in a way that’s somewhat reliable.”
Take this plot of the results of an experiment involving random results. See that wavy pattern? We have a name for it. It’s called the Normal Distribution.
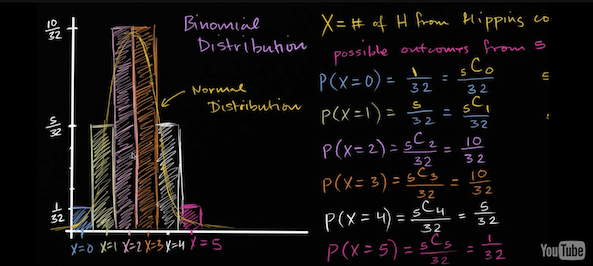
The details are irrelevant: just know that we’re now using charts, graphs, and equations to describe random behavior. If I asked you a thousand years ago, “hey mate, I’m gonna flip this coin 5 times, tell me some math about it.” you’d say “mate are you crazy? There’s no math to describe that shit.” But now look: we have a language to describe it. We’re making progress.